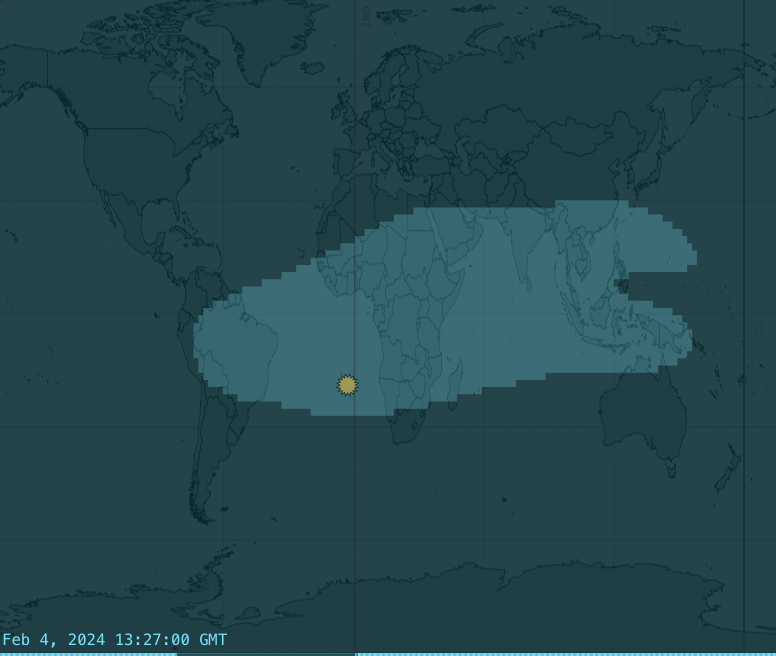
This is a 2d visual map of the concentration of electrons in the ionosphere.
“The plot illustrates the height integrated electron density (TECU, 1 TECU = 1.e16 electrons/square meter) also called Vertical Total Electron Content (VTEC), vs latitude (-90 to 90 deg) and longitude (0 – 360 deg) from the Coupled Thermosphere Ionosphere Plasmasphere Electrodynamics Model (CTIPe).” swpc.noaa.gov
In this image, the data is resampled by (4) on longitudinal axis and by (2) on latitudinal axis.
A gaussian filter with a (2.5) sigma value is applied to the data of shape [80 x 192].
These values are thresholded to (1.7) times the mean value to obtain the shape.
I’ve worked with this dataset for long while now and I can’t over-emphasize how much the shape appeals to me. It looks like a whale-ghost or something.
3 Comments
oh fuckall
blueprints
Side nothing