Code: Three.js Experiment (3)
https://scottandrecampbell.com/static/tool-7.html Programmatic/Dynamic mesh generation in threejs.
https://scottandrecampbell.com/static/tool-7.html Programmatic/Dynamic mesh generation in threejs.
A long time ago I took a stab at making my own small js library for WebGL development. That taught me a ton but in this modern world, the people developing three.js vastly surpass in their time what you can roll on your own in yours. They made all the classes. I toyed with three.js … Code: Three.js Traversible Nodes
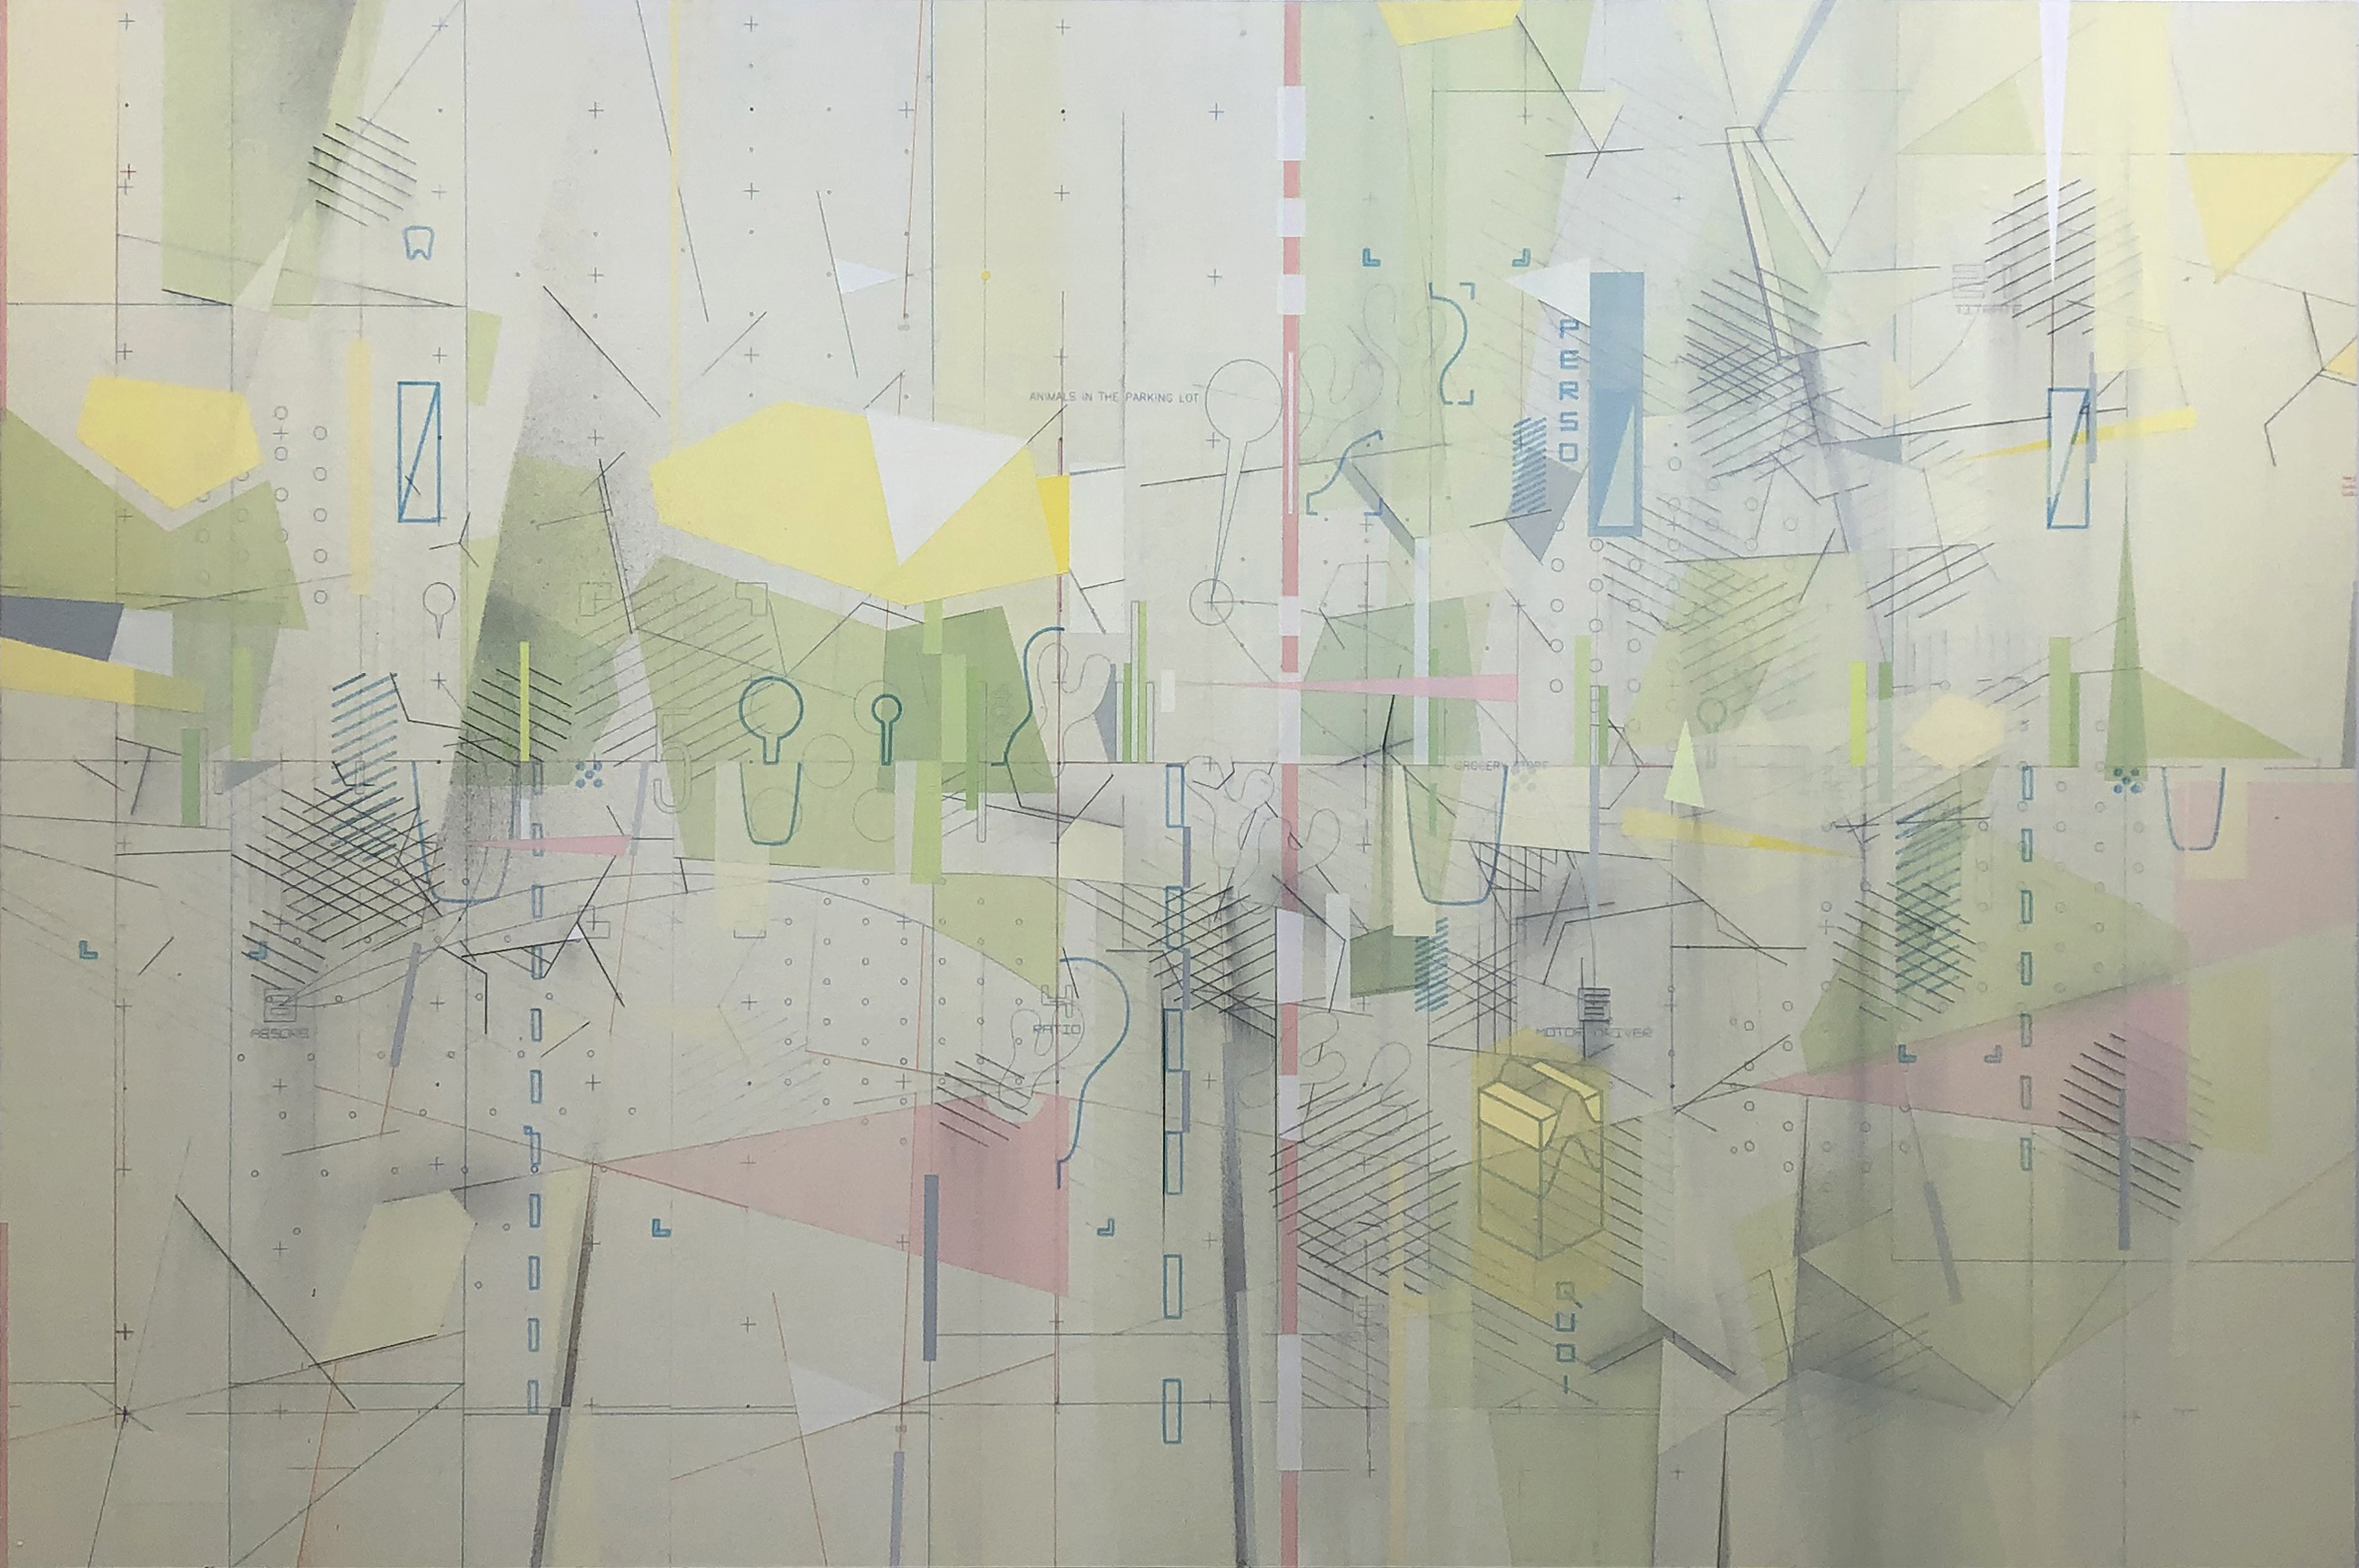
Work on paper on panel Handbuilt cradle. 3.5in cradle depth. RESIST Exposition @soapboxartsvt 2021
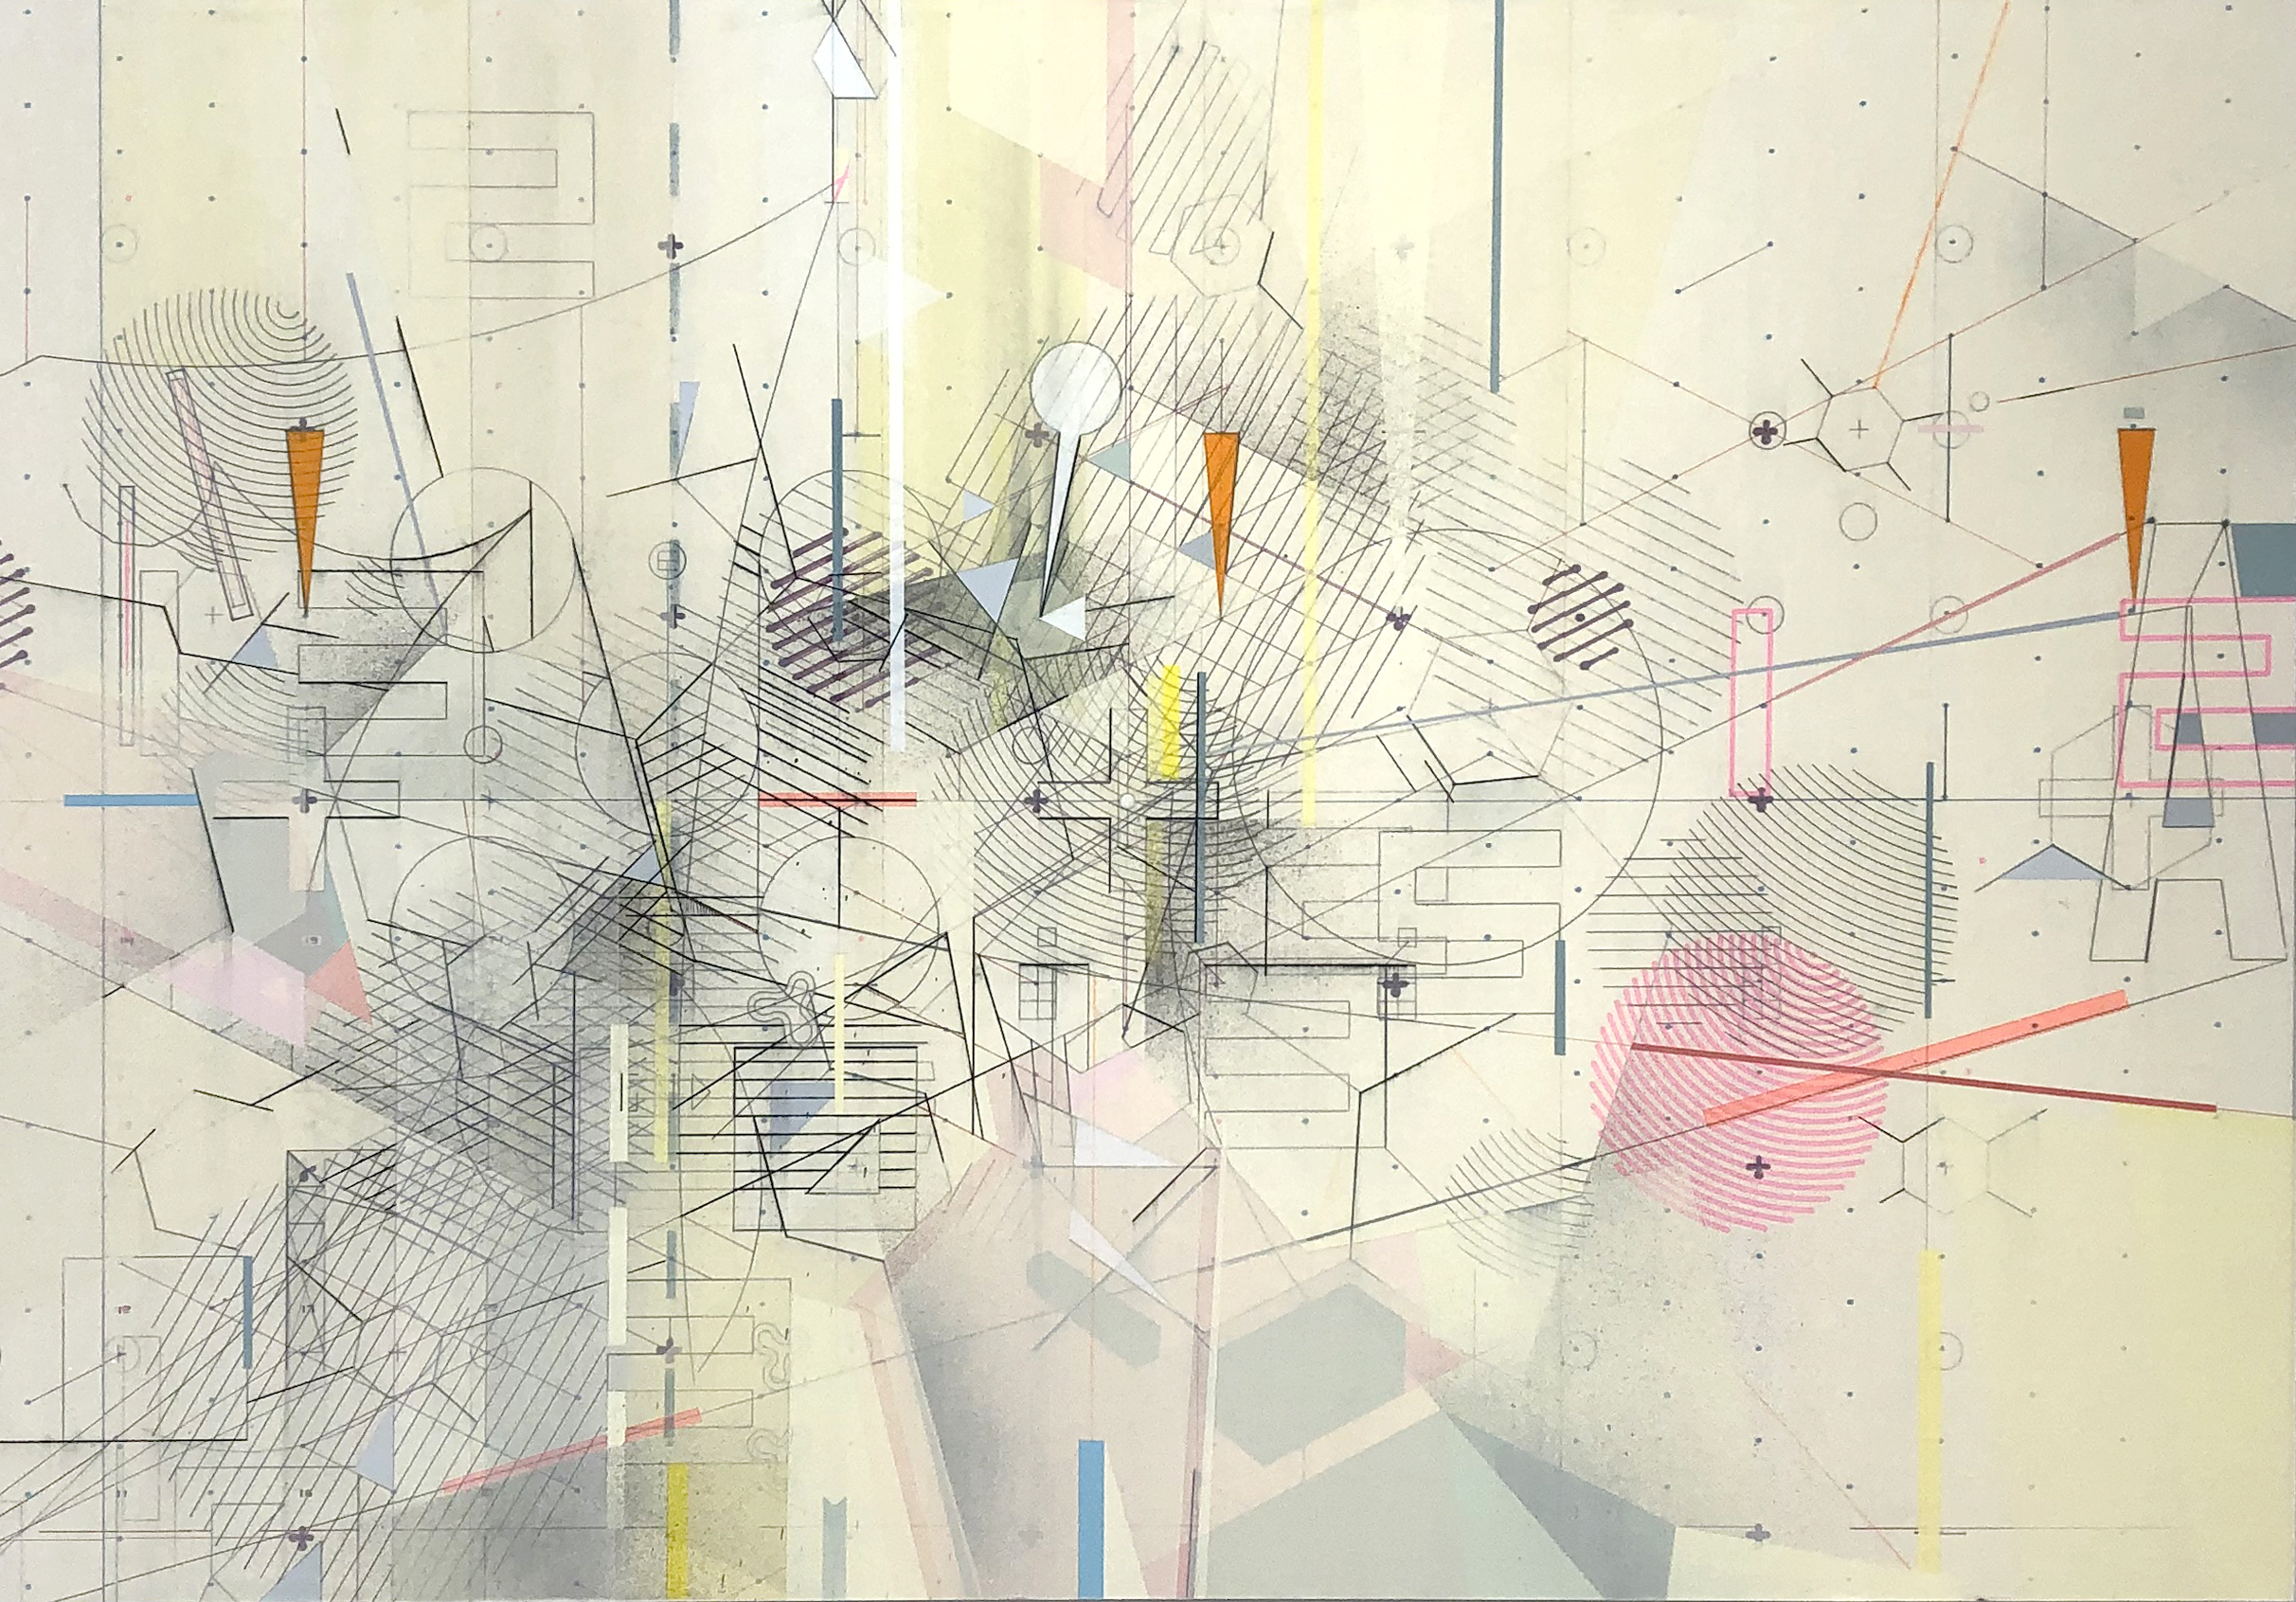
Work on paper on panel Handbuilt cradle. 3.5in cradle depth. RESIST Exposition @soapboxartsvt 2021
https://scottandrecampbell.com/static/AEROSOL-6-15-e.svg This is an example of building a vanillaJS interactivity layer directly into a scalable-vector-graphics (SVG) file. The source SVG is a print built in Illustrator 2021. The interactivity is meant to create a fluid narrative that traverses the artwork at different scales. This is optimised for desktop. The functionality for moble events isn’t implemented … Code/design: AEROSOL
In Spring of 2021, I started looking for ways to embed vanillaJS in scalable-vector-graphics files (SVGs) to make self-contained image based animations. The first use case I encountered was a client that was looking to “spice-up” some static background svg content. I stepped in after many attempts at using CSS DOM manipulation to create movement … Code: NodeTree SVG
The RESIST exposition happened just after my work on the THREADING project. Here is the artist’s statement from RESIST: This work was made between mid-February and mid-April of 2021. I spent the previous year building a system that can draw mathematically programmed information (known as a Plotter). My intent was to open my access to … RESIST Exposition at Soapbox Arts
An interminable hardware/software project that began with the lockdown (March 2020) and Finished around January 2021. Threading plotted(printed) a map of ionospheric excitation for 2 weeks. THE SYSTEM involved the design of computer software that controls a machine (robotic) to draw information. Details can be found in the following PDF file (4 pages): THREADING digest … THREADING Exposition at Soapbox Arts